The tale of two widely tracked semiconductor Exchange-Traded Funds (ETFs) is a great study on the dynamics that govern ETF performance in the captivating world of technology investing. These semiconductor ETFs, the VanEck Vectors Semiconductor ETF (SMH) and the iShares PHLX Semiconductor ETF (SOXX), although fundamentally similar, have shown distinct performance patterns over the last few years. Among the intriguing discoveries, SMH seems to be holding up better than SOXX.
First, let’s delve into the composition of these two ETFs. Notably, both ETFs track companies broadly classified as semiconductor businesses. This includes firms that manufacture and sell semiconductor machinery, those that design and develop the actual microchips, and companies that offer associated software and consulting services. Representing the pinnacle of technological innovation, these firms stand at the forefront of various digital trends such as Artificial Intelligence (AI), Internet of Things (IoT), autonomous driving, and cloud computing.
Despite tracking similar sectors, the difference in performance is primarily influenced by their portfolio allocation strategies. SMH uses an allocation strategy that is heavily influenced by the size of the companies it holds, essentially a market capitalization-weighted strategy. The top ten holdings account for about 60% of SMH’s assets. Owing to this higher concentration, the performances of a few large semiconductor companies heavily influence this ETF’s return. With major players such as Nvidia and Intel in its portfolio, strong performance from these giants would naturally buoy SMH.
On the other hand, SOXX deploys a modified market capitalization-weighted strategy. This approach limits the weight of any single security to a maximum of 8%, making it more uniformly distributed across the sector. As a result, the top ten holdings account for less than 60% of SOXX’s assets, reducing the influence any single company might have on the overall performance.
Another distinguishing factor is the geographical exposure of these ETFs. SMH has a substantial allocation to companies based in Taiwan around 25% of its holdings, offering broad exposure to the world-leading semiconductor foundry, TSMC. With TSMC showing strong performance owing to the global chip shortage, SMH is well-positioned to benefit from this situation. Conversely, SOXX has a more U.S.-centric strategy, with minimal exposure to international semiconductor companies.
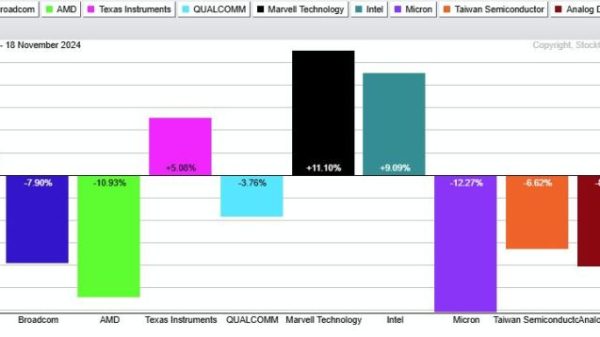
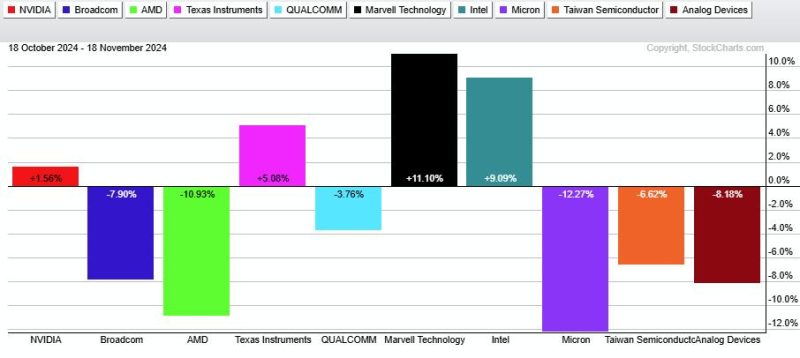
The individual stock performance within the ETFs also plays a crucial role in differentiating the returns. Nvidia and AMD have performed remarkably well, and with both being significant holdings in SMH, this has helped boost its performance.
Finally, market factors such as trading volume and liquidity also contribute to the differential performance of these ETFs. SMH’s average daily volume is higher than SOXX’s, fostering greater liquidity. Higher volume ensures the ETF is easier to buy or sell without incurring a significant impact cost, making it more attractive to investors and potentially strengthening its market position.
In summary, the story of SMH and SOXX revolves around the dynamics of allocation strategies, geographical exposure, individual stock performance, and market factors like liquidity. While both ETFs have different risk-reward balances, their recent performances underscore the importance of these key differences. SMH is maintaining resilience due to its relatively concentrated holdings, strong performers, global exposure, and higher liquidity, providing investors with significant food for thought when comparing these two semiconductor ETFs.


