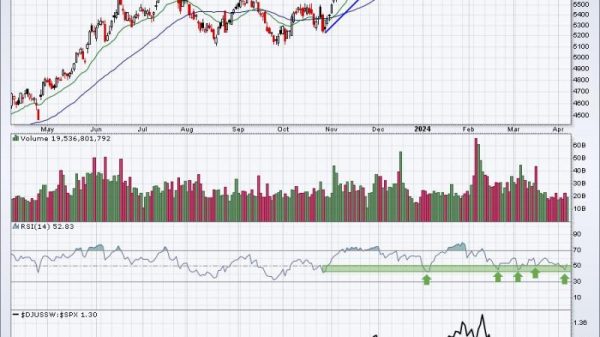
In the investment world, it’s not uncommon to come across investors who use market breadth as an indicator of market health. While markets might appear stable on a surface level, paying attention to market breadth can reveal a different story. In recent times, stable markets have generally given investors a false sense of security, making them believe that all is well. A closer look into the breadth, however, points at lurking dangers in the seemingly calm waters. This article will examine the relationship between market stability and breadth to illuminate the hidden risks that investors might be overlooking.
When we speak of market stability, the first thing that probably comes to mind is a low volatility level. In a stable market, asset prices move steadily in a predictable pattern, virtually unhindered by severe fluctuations or sudden changes in investor sentiment. Often, such conditions may lull investors into complacency, causing them to disregard potential hazards looming beneath the quiet surface. But for the sharp-eyed observer keen to understand the overall market pulse, breadth indicators become indispensable.
Market breadth refers to a method of gaiving insights into the number of stocks advancing relative to those declining. If the number of stocks rising exceeds those falling, the market breadth is said to be positive, indicating that the wider market rally is broad-based and healthy. On the contrary, a negative breadth, with more decliners than advancers, paints a somber picture of the market.
So, how does a stable market coexist with danger signals from breadth indicators? Picture a scenario where market indices are consistently posting steady gains, yet the number of declining stocks outweighs the gainers. This scenario, featuring a negative divergence, unveils a significant contradiction that investors should not ignore. It’s a warning that while the overall market appears stable and rosy, a larger proportion of stocks are struggling, and a correction could be imminent.
Advanced decline line (ADL) serves as a chief tool to gauge market breadth. The ADL is a cumulative total of the difference between advancing and declining stocks. When we see the ADL rising while major market indices also sustain an uptrend, we can say the breadth affirms the market’s stability. A deviation from this synchronous movement spells danger. Therefore, even in a condition where the market appears stable or bullish, a continually falling ADL suggests that fewer stocks are propelling the market higher. This weak undercurrent signals the potential for a trend reversal, potentially leading to a bear market.
Another critical indicator of market breadth is the Arms Index, also known as the TRIN (Trading Index). This index lets investors measure market breadth by comparing advancing and declining stocks’ volume relative to the total number of advancing and declining issues. Higher TRIN values indicate bearish market environments, while low values suggest bullish environments. An escalating TRIN in a seemingly stable market could indicate that although the market’s surface appears calm, there’s turmoil beneath, masked by a small number of heavily traded shares sustaining the index.
So what’s the key takeaway for investors? Market stability, though desirably peaceful, may subtly veil weaknesses within the market. It’s crucial not to overlook the insights that breadth analysis can offer. Just because the market appears stable doesn’t mean that it’s devoid of risk. Broad market indices might be gliding steadily on the surface, while a much more significant number of stocks are lagging or falling beneath the surface. This divergence is where the danger lies and is precisely what investors need to watch out for while gleaming market information.
In essence, while market stability is a good sign, we cannot merely judge the cover’s book. A deep dive into market breadth indicators can offer crucial perspectives on the stability’s genuineness and reveal potential risks lurking just below the seemingly calm waves. Therefore, paying attention to breadth indicators doesn’t just help one predict possible market reversals; it also assists in creating a more rounded, holistic strategy for managing potential risks and maximizing return.


